Lancaster County Flood Risk Dashboard
The Lancaster County Flood Risk Dashboard displays various different elements throughout the county and Lower Susquehanna River Basin, giving viewers real-time information on rainfall forecasts, chances for excessive rainfall and stream gauge levels, as well as information regarding historic flood events throughout the area.
Click on the image below to interact with the dashboard!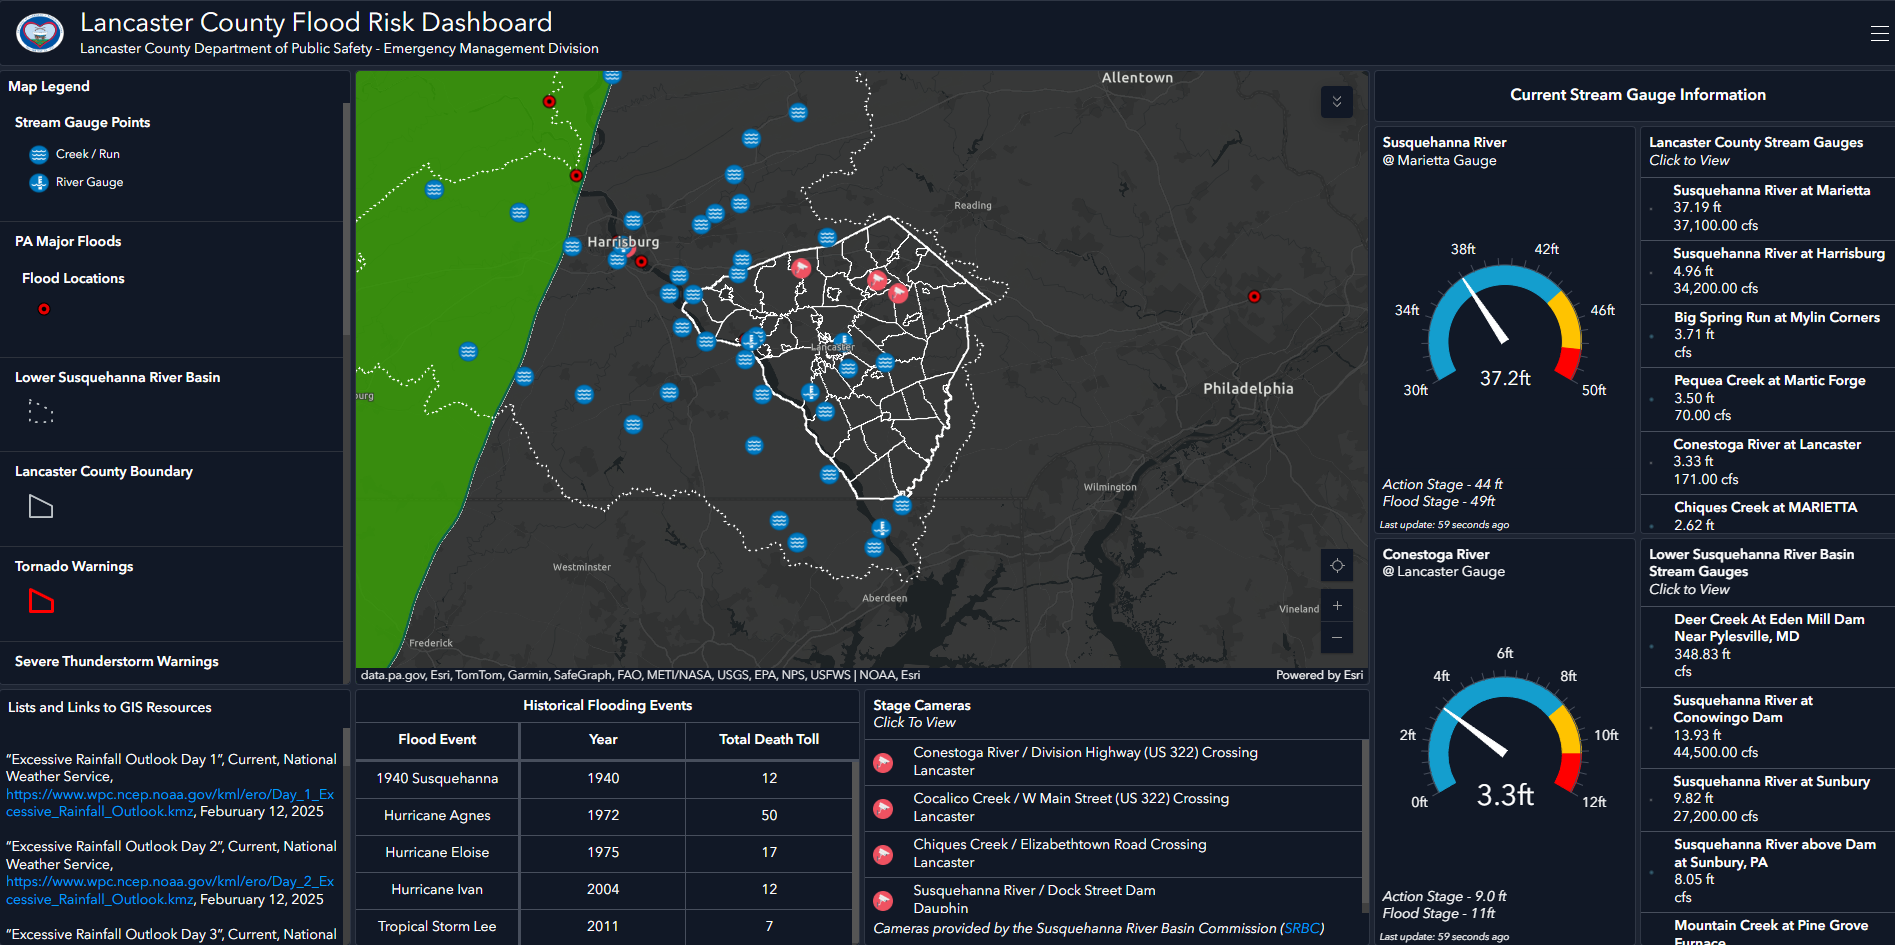
Using Different Dashboard Tools
Find your Location
The dashboard allows you to search your specific location and view it in the map.
- Click the drop-down menu in the top right Area of the map
2. Click the search icon and input your address, then press enter
Viewing Different Stream Gauges
There are many different stream gauges that can be found throughout Lancaster County and the Lower Susquehanna River Basin, displaying information such as flooding status, current height and flow. To view a stream gauge:
- Find and select one of the stream gauges from the lists found on the right side of the dashboard.
- Click on any of the gauges listed to view its pop-up window.
Viewing Stage Cameras
The stage cameras, provided by the Susquehanna River Basin Commission (SRBC), provide a live feed of multiple rivers/stream locations throughout the county.
- Find the desired camera location from the list at the bottom of the dashboard.
- In the pop-up window, click view in the camera section.
- After you click view, you will be brought to a separate window showing the live feed. The webpage is automatically set to update every 10 minutes. To see more frequent images, click the dropdown menu under the image and select the desired rate.
Excessive Rainfall Outlook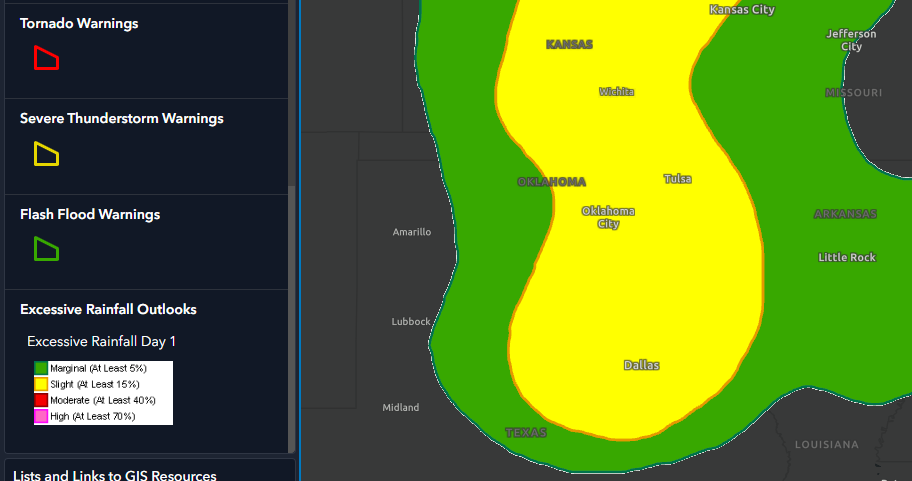
The excessive rainfall outlook gives a percentage forecast for the chance of rainfall that could cause flash flooding. The National Weather Service will issue outlooks with ranks of Marginal (green – at least 5%), Slight (Yellow – at least 15%), Moderate (Red – at least 40%) and High (Pink – at least 70%). These percentages can be seen in the map legend on the left side of the dashboard.
Excessive Rainfall Outlooks – day 1, 2, and 3
The Day 1 outlook is displayed by default; however, to view days 2 and 3, the different layers can be turned on through the map’s Drop-down menu.
- Find the Drop-down menu at the top right of the map
- Click the “layer” Icon to bring up a list of layers
- Scroll to the bottom of the list to find Excessive Rainfall Outlooks. Click the drop-down arrow to see days 1, 2, and 3, then click the eyes to display or remove layers.
All layers in the dashboard are able to be turned on and off with this method as well.
Quantitative Precipitation Forecast (qpf)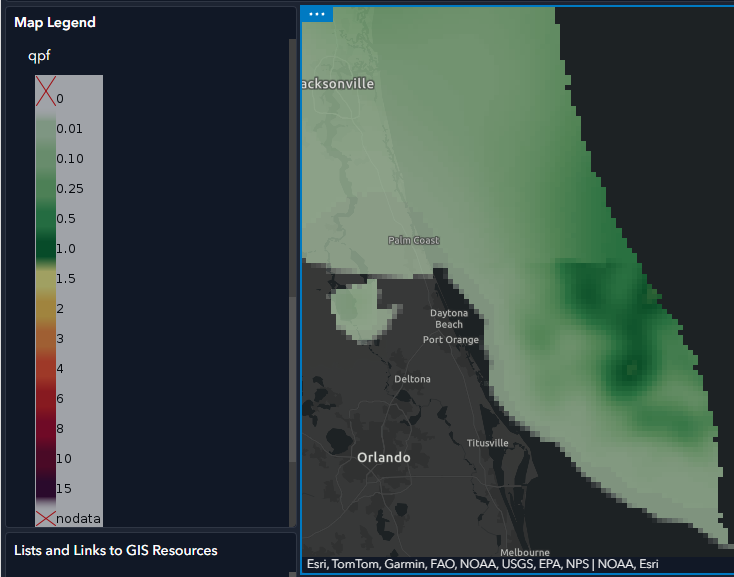
The quantitative precipitation forecast is a 6-hour forecast of rainfall projections. The forecast appears as a color gradient over the forecasted area, ranging from 0.01 - 15 inches of rainfall. The qpf projections can be seen in the Map Legend on the left side of the dashboard.
Flash Flood Guidance
The flash flood guidance layers are a tool that estimates the amount of rainfall required over an area to cause small streams to flood. The dashboard incorporates the 1 hour and 6-hour flash flood guidance, both of which can be turned on in the layer's menu.
- Click the drop-down menu in the top right corner of the map, then select the layers icon
2. Scroll down to find the flash flood guidance layers. Click the eyes on the right of the layer to turn them on or off.
3. Find your area and compare the flash flood guidance to the map legend
Historical Flood Hazard Areas
The Historical Flood Hazard Area gives an idea of the areas that are at risk of seeing major flooding over an annual period with 1% being the greatest risk and 0.2% being a rarer risk of major flooding but still plausible.
- To toggle the layer on or off, you will need to access the layers tab.
- Then, you’ll need to scroll through the layers to find the ‘Historical Flood Hazard Areas’ Layer and either toggle it on or off depending on your preference.
Historical Flooding Events
This Historical Flooding Events aspect allows for people to see some of our biggest flooding events across the state of Pennsylvania with a chart that outlines some of the more prominent flooding events across the lower Susquehanna Valley.
The chart shows the year as well as the death toll and if you click on the red dots on the map, you can also see the total cost of the flooding event.